
As a product manager, you’ve likely heard the advice to make data your superpower. However, it’s more than just creating a few charts and visualizations for stakeholder presentations. Understanding how different types of data are handled and presented at various stages of the product lifecycle can significantly impact your effectiveness.
Every stage of product work basically involves convincing stakeholders to see things a certain way - why not use the right data in the right format to get things across better?
Before we get into it, let’s clarify what I mean by data in this article. It is basically any form of information that can be considered a fact (for the most part) and used to inform an opinion.
Misconception: Data is limited to charts, visualizations, % metrics.
What data can also be
- Screenshots of user feedback (reddit threads, online discussion forums, social media comments)
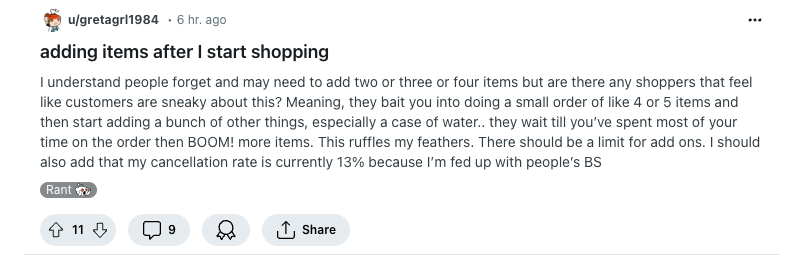
As a product manager, seeing a good number of these kinds of comments makes you wonder about solutions to solve this problem for Instacart shoppers → a powerful way to communicate a point especially to partner teams who are pushy and not aligned.
- Articles on industry trends (popular magazine articles, highly rated industry rankings, influencer content)
Influencers with millions of followers tend to put out content that is quite vetted, usually. Allie is a tech influencer, part-time investor, and VC who writes to millions of people on LinkedIn. Following some top industry voices gives you some clues about things going well or not for your product and also an idea about key trends in the industry.
- Research paper findings (paperswithcode.com is your pot of gold.)
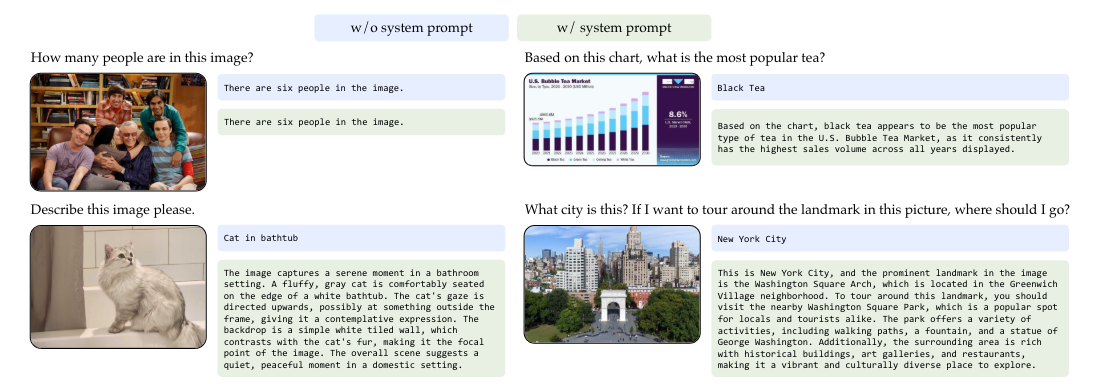
This screenshot is taken from a recent paper driving home an important point about a new LLM algo. It’s not a chart or a visualization but it’s pretty dang convincing around its effectiveness.
Great, so we know that there are tons of kinds of data that you can use as a product manager. Now, let’s talk about the various stages of the E2E product lifecycle where you may be using this data.
Brainstorming
Yes, great product managers come prepared, even to brainstorming meetings. During brainstorming, the goal is to explore ideas, identify opportunities, and generate hypotheses. You want to understand customer pain points, market trends, and get nods towards potential solutions from your team mates. At this stage, gather qualitative insights from user interviews, surveys, and competitive analysis. Look for patterns, unmet needs, and emerging trends. The idea is to provide enough data to spark ideas from the team. Don’t overwhelm them with a ton of data, avoid relying solely on gut feelings or personal biases and try not to dismiss unconventional ideas prematurely.
Let me talk about an experience I had as a product manager enhancing Bing.com at Microsoft. I focused on making our search engine safer and more ethical. During a hackathon, I aimed to improve the search experience for troubled teens who often sought self-harm-related information. Unfortunately, the search results were inadequate, even bizarre, showing news articles about celebrity suicides, back then.
Motivated by this user need, I delved into queries related to depression and loneliness, meticulously capturing screenshots. I then presented these visuals to my coworkers, sparking candid discussions. Surprisingly, my colleagues resonated deeply with the issue. Loneliness and depression emerged as universal themes.
Together, we brainstormed solutions and created an enhanced search feature called ‘Mental Health Answers’ on Bing.com. Remarkably, our innovations caught Google.com’s attention, leading to their adoption of similar features. More details to follow!
Convincing stakeholders
You’re aiming to secure buy-in from executives, engineers, and cross-functional teams. You want to demonstrate the business case for your product. If you want them to support you, you need to explain why solving this problem matters to them. Give them a high level overview of your context, yes, but very quickly get to brass tacks. Quantify the opportunity.
Talk about metrics like ROI, customer acquisition cost (CAC), lifetime value (LTV), and total addressable market size. Also, gather success stories from early adopters. Tons of product managers make humongous decks with tons of data for these alignment meetings. All it takes is one slide to convey what you need. Avoid overwhelming stakeholders with too much data. You want them to understand what the idea is and why it needs to be solved.
Remember, 10 days of data querying does not mean a 10 slide deck - keep it short and simple, just like a sales trick!
Jumping back into the ‘Mental Health Answers’ story - after completing the initial brainstorming stage for “Mental Health Answers”, the next crucial step was to persuade stakeholders to greenlight our project and run an A/B test to validate our hypothesis. Our target audience included partner engineering teams, UX designers, and data scientists. It was imperative to convey the significance of solving this problem effectively. In this scenario, mere screenshots wouldn’t suffice. I had to get as technical as possible.
Collaborating closely with my data team, I quantified the frequency of these specific search queries on Bing and established key performance indicators (KPIs) to measure success. Drawing from historical improvements, I presented a well-calculated opportunity analysis to each stakeholder, outlining the potential gains and the necessary time and effort investment. Fortunately, all stakeholders aligned, and we commenced building this transformative experience!
Presenting findings to leadership
After research and testing, it’s time to share insights. You want to inform product decisions and guide iterations. You also want to bask in the glory of a successful beta test maybe. Remember, leadership has seen hundreds of such launches. Most of the time they just want to know something is broken and the product is working well in the wild.
You’ll need to showcase results from A/B test and/or usability studies using the following metrics:
- Test design : user size, segment distribution etc.
- Success metrics : Improvements to KPIs.
- Guardrail metrics : No negative impacts to other parts of the business.
- Success stories : screenshots of customer feedback, newspaper articles, etc.
After conducting the A/B test for “Mental Health Answers,” our stakeholders, leadership team, and legal department expressed curiosity due to an article published by Search Engine Land. I presented the big picture, highlighting positive KPI movements and the absence of negative effects on search engine guardrail metrics.
A challenge arose because each stakeholder had varying interests in specific page-level metrics, but this had to be expressed in a business forward way. I carefully crafted a concise representation of the data post several teammates proofreading my slides. This got us a positive response from leadership, so we swiftly moved on to the next phase: product launch!
Product Launches
It’s go time! Pre-launch, you’re ensuring everything is set for a successful rollout. You’re probably working with marketing, operations, customer success etc to ensure a smooth launch. For these kinds of audiences, it’s once again best to keep it short and easy to digest.
- Offer frequent updates around KPIs.
- Create dashboards for stakeholders to use to investigate in case of bugs/failures. Go one step ahead and give them a tutorial around how to use it. Empower them to make data driven decisions themselves.
- Setup alerts for yourself and the stakeholders on KPIs, guardrail metrics etc and do frequent readouts to maintain mojo and catch issues early. Send out any positive movements in metrics as success mails to stakeholders.
When preparing to launch ‘Mental Health Answers,’ I recognized that it would be an iterative user experience. Moreover, it needed to seamlessly coexist with other platform components outside our team’s ownership. Ensuring its success wasn’t just about the launch; we had to maintain its value post-launch as well.
To achieve this, I engaged with stakeholders directly impacted by our project, including the search engine platform team and the web content team. By understanding everyone’s target metrics, I gained a holistic perspective. With this in mind, I designed a comprehensive dashboard. This dashboard not only tracked the metrics we cared about during the launch but also included those relevant to other teams. We set up monitoring and alerts for these metrics, ensuring ongoing visibility and accountability. To this day, the dashboard remains a valuable reference for all involved teams.
The final web experience looks like the one below.
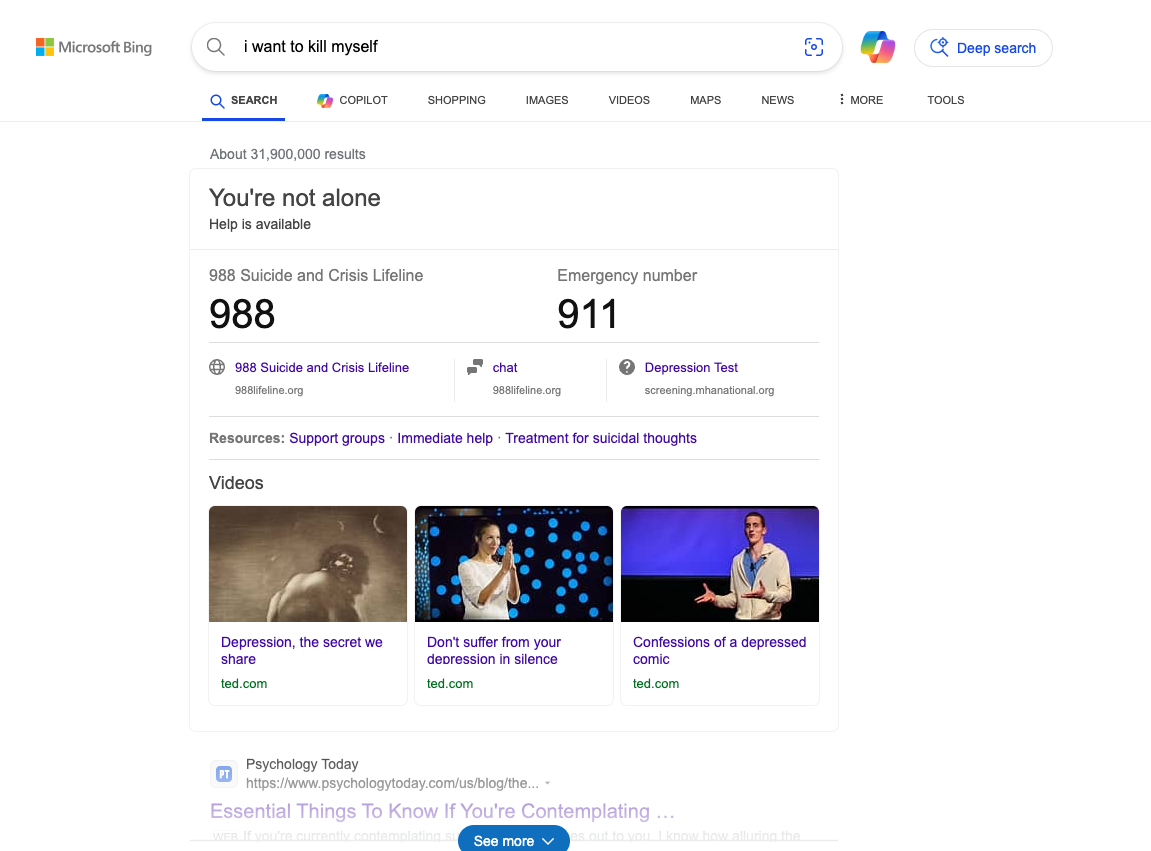
Soon after, Google came out with a similar experience. A kind validation of our efforts and value-add to the end user! :)
Now that you know what data to use, when and how to use it in these conversations, your product manager career will never be the same. I wish you all the best in your alignment endeavors. May the data ever be in your favor!


Comments
Join the community
Sign up for free to share your thoughts