Prioritization of work is hard: it’s often more an art than a science. Unless you work in an organization that has mastered the delicate balance of work from a prioritized roadmap as well as customer requests, you too may often be faced with squeaky-wheel prioritization: The customer yelling the loudest (or the one who last spoke with sales or the CEO) gets what they want.
We product management professionals thought there must be a better way to figure out prioritization, one that’s more “scientific” and less subjective. So various schemes for prioritization emerged from the industry, looking at the benefits of features such as new revenue, customer retention, cost savings, … you name it. Either one or multiple of these factors were being considered and summarized into terms such as “business value”. Agilists quickly pointed out that absolute values (e.g. dollars) make things hard to compare and that measurements are often imprecise, so we started thinking in relative business value points.
Great, so now we have a way of systematically prioritizing our features, right? As long as we work our way down our feature backlog in descending order of business value, we’re making sure we deliver the most value to the business and we solved the problem of old-school prioritization, right?
Well, not so fast, cowboy. I think we’re missing something here. Stay with me as I walk you through an example:
Let’s say we have four feature candidates to pick from for an upcoming quarter, each assigned with business value points (for simplicity, using a scale from 1-10):
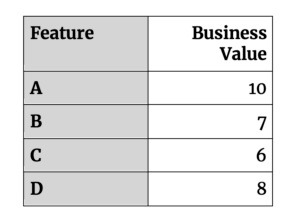
The obvious thing would be to work through them in order of business value, so we’d work our way down the list like this in order to maximize value.
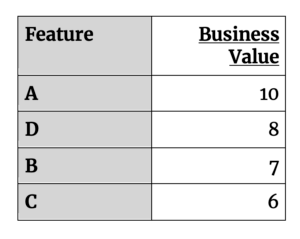
But since we might not be able to complete all of them in the given timeframe, we have to look at the size of these items, so we can make appropriate commitments to our internal and external stakeholders. Therefore, let’s add “size” to these features – in this case we’ll call it “effort” and use the same 1-10 scale:
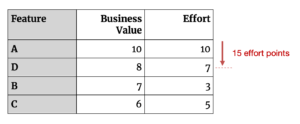
Let’s say that our capacity for the quarter is 15 units of “effort”. Given the sequence above, by the end of the quarter, we will have delivered the first feature and will be in the middle of implementing the second feature. Sorry, earned value folks, but since we didn’t actually deliver the second feature to customers, we can only claim to have delivered 10 value points in this quarter (feature A).
So what’s missing here? We are ignoring the effort in our prioritization. If you had two features with 10 business value points, one with three effort points and one with eight effort points, which one would you work on? The one with the smaller effort, of course! This is where ROI comes in: How much return do we get from the effort we’re expending? (Kinda like return on effort/“ROE”) The 10 business value point feature requiring only three effort units has a significant higher return for each unit of effort.
Therefore we’ll add another column to our original spreadsheet, showing the return per unit of effort:
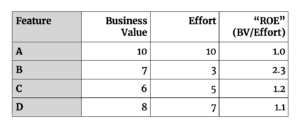
Now we can look at this and prioritize the work based on ROI instead of just business value alone. Once we sort our backlog by descending “ROE”, a new, maybe surprising, sequence emerges:
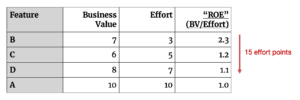
So Feature A, the one with the highest business value, now ends up on the very bottom of our backlog! That’s right. This is because of the very high amount of effort it requires while other features with smaller business value offer a higher ROE.
Going back to what our next quarter could look like: With this new approach and rank order, we’ll be able to deliver 15 business value points (50% more than in the original sequence!) in the first quarter (features B, C, and D)! I’m pretty sure any business owner would agree that we deliver more value to the business by sequencing the work this way.
(For those of you in larger organizations who are employing the Agile scaling framework SAFe, you’ll obviously recognize the resemblance with the more sophisticated WSJF (“weighted smallest job first”) methodology, which uses the terms “cost of delay” and ”job size” instead. The nice thing about how SAFe defines cost of delay is that it consists of several useful sub-components, such as risk avoidance and opportunity enablement.)
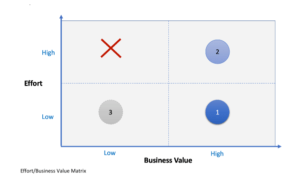
One technique that could come in handy during prioritization discussions is to place new features on a chart like this:
This view will make it pretty obvious that it’s best to focus on work in quadrant 1 (high value, low effort), followed by quadrant 2. Work in quadrant 3 is questionable while items in the top left quadrant should be eliminated altogether.
The takeaway from all of this is simple: Don’t just blindly sequence your backlog based on business value (or priority, or revenue opportunity, etc.). Take into account the effort/size and respective ROI/ROE. This requires a little more data as well as discipline, but it will literally pay off. Yes, it’s deceivingly easy to just rank your features by business value. But don’t be fooled: Ignoring effort is a mistake. Without looking at the ROI, you will not end up delivering the most value. That said, getting your stakeholders to take this new perspective will take some effort on your part. Maybe walk them through these examples and … “do the math”.


