
Data is the buzzword of modern business, isn’t it? Data is the driving force behind decision-making and sustainable development of a product. Being data-savvy is no longer just an advantage, it's a requirement.
Analytics are necessary whatever your product manager role, be it understanding your target audience, how customers are using the product or customer satisfaction with your product. A product manager must be able to identify, monitor, analyse and extract actionable insights from relevant metrics that reflect their product’s performance.
Your ability to harness the power of analytics as a product manager can mean the difference between a mediocre offering and a game-changing product. In this article, we'll look at world of analytics for product managers, at the best tools and approaches for shaping products that resonate with your target audience and how to use the vast amount of data around you.
What kind of data should product managers focus on?
Given the mammoth amounts of data available, it's important to remember that not all of it is useful for you. We can divide the data into the following groups for data-driven product management:
1. User data: Perhaps the foremost and the most important data you need. If you don’t understand your customers then you can't build the product!
User data helps you to answer a simple question: Why must we build the product this way?
And the answer is – because the customer likes it this way 😉
Assumptions and personal preferences are the death of user understanding. User groups, user persona creation, user interviews, A/B testing and card sorting are a few methods to conduct user research and understand your customers, and their future prospects and reach product/market fit.
2. Product Data: Just like you need to know what’s inside your user’s mind, you need to know what's inside your product. Product data includes what the customer journey looks like, how many people are onboarding, is the onboarding process too tedious, which features are being used most by the customers or where is the maximum dropoff. This will give you an insight into whether your product is actually working or not. It may lead to an innovation or a pivot that you might otherwise not have considered.
3. Market data: Knowing the market is extremely important prior to developing and launching your product. Before you can design something that meets the expectations of your customers, you must first understand the ecosystem in which your product will be expected to thrive.
Remember that market research is not a one-time thing. This is where businesses often go wrong – they conduct market research only at the beginning of the journey. However, the competitive landscape keeps changing, and you must have a clear sense of what it looks like before launching each new product. You must learn what your competitors are doing, how you may differentiate yourself from them, and what demands are consistently unmet. Competitor analysis, user segmentation, branding analysis, etc. are a few market research that need to be done.
Product metrics you need to know to understand your product
After you have the data, focusing on the right key performance metrics is the most important next step. Let's divide the product metrics into broad categories:
1. Customer engagement metrics
a. Daily active user (DAU): This is the number of active customers that use your app on a daily basis. The higher the DAU the better, this means that more users are signing in and using your application, while a lower DAU means your product is not suiting your target audience. When evaluating DAU, it is imperative to establish a specific characterization of an "engaged user" within the context of your product. As an illustration, consider a social media platform where an engaged user could be described as someone who posts, interacts with posts, or comments on content, as opposed to merely logging in and out of the platform.Along with DAU, there also comes an important metric of MAU – Monthly Active users, which measures unique users of your product within 30 days. This helps you measure in terms of retention in contrast to DAU which helps you measure in terms of popularity and reach.
b. Session duration and frequency: Session duration is the time spent by the user on your app in one go while session frequency defines the number of times the users reach out to your product in a given period of time. When examining user data, it's advisable to contrast the frequency of session duration across various groups of customers – both existing and churned. This approach can unveil trends and enable proactive measures to enhance customer retention.
c. Session per user: It represents the count of instances when your users initiate distinct sessions within a specific timeframe. This metric can serve as a dependable indicator of whether your customers are experiencing the desired benefits with each interaction, contributing to the enhancement of your product's overall user-friendliness.
2. Retention Metrics
Customer retention metrics provide insights into the duration for which a user remains engaged with your product. In addition to understanding the satisfaction of your current customers towards your product, these metrics also offer the ability to assess the alignment between your product and the intended target audience.
a. Retention/ churn rate: The retention rate denotes the proportion of users who continue utilizing your product throughout a specific time frame. A robust retention rate indicates a consistent delivery of value to your customers from your product. PMs usually calculate retention rates at different time periods- weekly, quarterly, and yearly. It’s the most important KPI that can let you know that you are solving a valued problem.
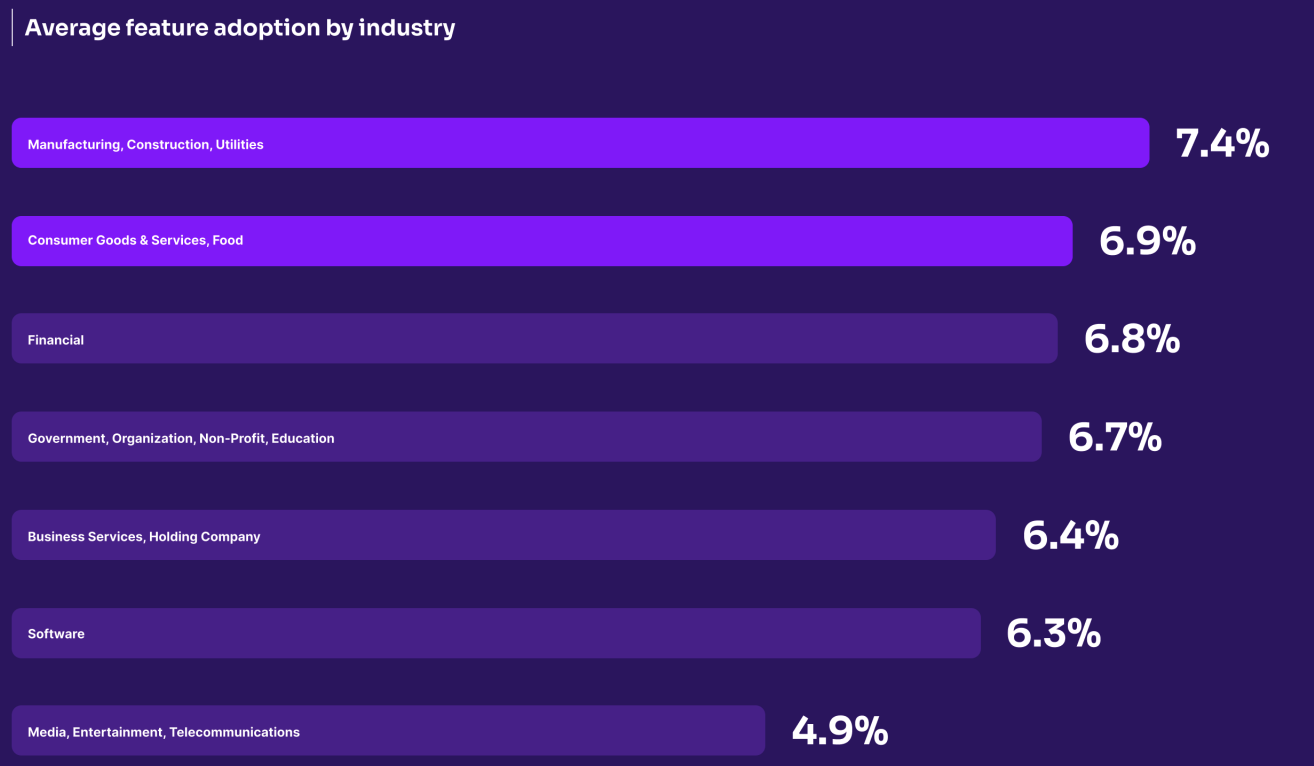
b. Feature adoption rate: It defines how early users use and adapt a new feature. In analytics-based product management, this metric helps PMs analyze how accurately they understand the customer’s problem and resolve a solution to it.
3. Monetization Metrics
These metrics help track the revenue and evaluate the product’s and business’ financial performance.
a. Customer acquisition cost (CAC): It refers to all costs incurred in signing up a customer. It is recommended to recover your CAC in less than one year of your customer’s subscription. The goal is to increase customer lifetime value and average revenue per unit or user/account, while cutting CAC, to maintain a profitable business. Though less CAC is desirable, more CAC doesn’t mean that the business is not profitable – it all boils down to whether you have attracted the ‘right customers’.
b. Customer lifetime value (CLV): It’s the metric to track key customer experience programs and understand how valuable the customer is to your company. It is defined as the net profit the company is expected to generate from a customer throughout its relationship with the business. Since this metric quantifies customer relationships, it incites you to create better customer retention strategies.
c. Monthly recurring revenue (MRR): It is how much your business earns monthly! As simple as that. This becomes an important metric because it is used to set goals based on business performance over time. This idea extends to annual recurring revenue (ARR). It gives a macro business view rather than a micro view in the case of MRR.
d. Average Revenue per user (ARPU): Picture a bustling coffee shop. In a month, 100 regulars visit, spending varying amounts. Jane buys a latte and a pastry, spending $7, while Mark opts for just a $2 black coffee. The total revenue for all customers is $586. Your ARPU is $586 / 100 = $5.86. This metric is a barometer of your cafe's financial performance, gauging how much, on average, each customer contributes. Like diverse coffee preferences, ARPU unveils unique insights into your business's profitability tapestry and thereby helps in setting product goals.
4. Satisfaction metrics
These help you to gauge if your customers are satisfied with your product and if the product is meeting their expectations.
a. Customer satisfaction score (CSS): Customer contentment is reflected in the customer satisfaction score. Customers assign a numerical value, typically ranging from 1 to 5, to your product while potentially providing extra insights into the rationale behind their rating. By prompting customers to evaluate different facets of your product or enterprise, you can precisely pinpoint areas warranting enhancement.
b. Net promoter score (NPS): This defines the likelihood of the customer using your product to recommend it to others on a scale of 1-10. Apart from customer satisfaction, this score helps to assess customer loyalty.
Individuals who rate within the range of 9 to 10 are categorized as "promoters," those falling between 7 and 8 are labelled as "passives," while those in the range of 0 to 6 are termed as "detractors."
How companies analyze their products, a small guide to product analytics methods
After collecting data, and getting to know your metrics, the next step is to understand and apply these metrics.
- Funnel analysis: Understanding the user journey from initial interaction to conversion is crucial. Analyzing funnel data helps identify drop-offs and bottlenecks- imagine a virtual shopping journey: users explore products, add items to the cart, proceed to checkout, and finally complete the purchase. This enables product managers to optimize the user experience and enhance conversion rates.
- Cohort analysis: Cohort analysis is a data-driven method that segments users into distinct groups based on shared characteristics or behaviors. For instance, consider an e-learning platform: Cohort analysis enables you to track how different groups of users who signed up in the same month engage with the platform over time. By comparing their progress, course completion rates and activity levels, you can uncover insights. For instance, you might find that users who signed up during exam season are more active than those who joined during vacations. This informs tailored strategies to enhance engagement, retention, and the overall learning experience.
- Retention analysis: Retention analysis measures the ability of a product to retain its users over time. For example, a music streaming app assesses how many users who signed up last month continue using the service this month. If the retention rate is 30%, it indicates that 30% of last month's users are still active. By tracking these trends across different cohorts, you can uncover insights. For instance, if the retention rate drops for users who downloaded the app after a recent update, it suggests a need to investigate and improve the update's impact on user engagement and satisfaction.
- A/B testing: A/B testing, also known as split testing, is a controlled experiment where two versions of a web page, app, or feature (A and B) are presented to users to determine which performs better. For instance, in an e-commerce site, version A might have a green "Buy Now" button, while version B has a blue one. By comparing metrics like click-through rates or conversions, you can identify which version leads to higher user engagement. A/B testing provides concrete insights into design and content decisions, enabling data-backed optimizations to enhance user experiences and achieve desired outcomes effectively.
Tools for product data analysis
Here are a few product analytics tools to try:
- JIRA: It allows you to follow the scrum framework while developing your product. It helps teams to communicate better by allocating, relocating, and changing tasks within a project.
- GOOGLE ANALYTICS: Google Analytics is still a must-have for product managers. It provides an extensive set of functions for tracking website traffic, user interaction, and conversion rates. Google Analytics’ customizable dashboards and extensive reports let you analyze customer journeys, detect drop-off locations, and optimize your product's user experience.
- MIXPANEL: An advanced analytics for product usage and engagement. It integrates with platforms such as Google Cloud, Optimizely, Zoho, and Slack. This tool differs from typical analytics systems in its methodology. Instead of analyzing page views, it examines actions or steps made by people who enter the monitored application.
- PENDO: For customer-facing businesses which need better user behavior tracking throughout the customer journey for better customer retention. It improves onboarding and feature uptake with targeted walkthroughs and messaging within the app. Data analysts can track product features and usage across web and mobile applications. Using Pendo Feedback, product and marketing teams may additionally gather, prioritize, and manage consumer feature requests.
- HOTJAR: Analyze user behavior with heatmaps and recordings. Hotjar provides a combination of analytics and user feedback. It includes heatmaps, session records, and surveys to help you visualize user interactions. You can monitor where people click, scroll, and hover with heatmaps, providing insights into user preferences and pain points.
- ZOHO REPORTS: Proficient in data visualization, this business intelligence and reporting tool is non-discriminating between small and large organizations. From pivot tables and tabular view components to KPI tracking and sharing and more Zoho projects have it all to create customizable dashboards that help get insights into project progress, and bottlenecks and can help in forecasting.
Ultimately, your mastery of analytics as a product manager delineates the distinction between the ordinary and the extraordinary. By harnessing this vast data landscape, you can sculpt products that resonate, captivate, and revolutionize the market.